Effectiveness of a Countdown Timer in Reducing or Turnover Time
Effectiveness of a Countdown Timer in Reducing or Turnover Time
Majbah Uddin, MS1, Robert Allen, PhD2, Nathan Huynh, PhD1, Jose M. Vidal, PhD3, Kevin M. Taaffe, PhD4, Lawrence D. Fredendall, PhD5, Joel S. Greenstein, PhD4
1Department of Civil and Environmental Engineering, University of South Carolina; 2School of Health Research, Clemson University; 3Department of Computer Science and Engineering, University of South Carolina; 4Department of Industrial Engineering, Clemson University; 5Department of Management, Clemson University.
Corresponding Author: nathan.huynh@sc.edu
Journal MTM 6:3:25–33, 2017
Background: In production environments, a countdown timer is used to report the status of the planned start time and to provide both a communication mechanism and an accountability aid.1 It has been used in the airline industry to remind all personnel of the remaining time until when the aircraft door should be closed. This study explored the effectiveness of a countdown timer in the operating room (OR).
Aims: This study was designed to assess the effectiveness of a countdown timer in the OR setting and to determine the factors that contribute to prolonged OR turnover time (TOT) (defined to be from the “procedure finish” time of the preceding case to the “procedure start” time of the following case), as well as the impact each of the significant factors has on TOT. In this study, the term case denotes a surgical procedure.
Method: An Android app named ORTimer was developed for the study. The app was installed on Android tablets that were placed at the Certified Registered Nurse Anesthetist (CRNA) workstations in the OR at Greenville Memorial Hospital (GMH) in South Carolina. The CRNAs helped collect the event milestones and record the delay reasons (if applicable). Additional OR case information was extracted from GMH’s electronic medical record. Regression analysis was used to identify significant factors that contribute to prolonged OR TOT and to estimate their impacts. A t-test was conducted to test the hypothesis that the use of a countdown timer is effective in an OR environment.
Results: The data from a total of 232 cases where the ORTimer app was used were examined. Among the factors (i.e., delay reasons and case information) considered, an outpatient from a following case had the highest correlation with excessive room idle time, which is the difference between the actual TOT and the allotted TOT. Delays due to patient-related issues added about 12.7 minutes to the turnover time (90% CI: 7.2, 18.3) when other factors were fixed. Delays due to preoperative-related issues added about 27.4 minutes to the turnover time (90% CI: 20.0, 34.7) when other factors were fixed.
Conclusions: As is the case with most production environments,1 the use of a visual management tool such as the countdown timer in the OR is found to be effective. Additional research is needed to determine whether this finding is applicable to other hospitals.
Keywords: Information Technology (IT) intervention, operating room efficiency, operating room process improvement.
Introduction
In this paper, we study the effectiveness of a countdown timer, delivered via a mobile application, in reducing turnover time in the operating room (OR), as well as its ability to identify factors that most influence prolonged turnover time. Before discussing the technology of the timer, we first introduce the relationship between cost and efficiency in the OR, and the effect that turnover time has on each.
An OR is a very costly unit for a hospital to operate. For example, it is estimated that the cost of operating an OR at Ohio State University Medical Center is $1,200 to $1,300 per hour.2 Furthermore, the opportunity cost of unused OR time is much higher than the operating cost of the OR.2 In a recent study, the variable OR labor (non-supply) cost was found to be $9.57 per minute at the partnering hospital, Greenville Memorial Hospital (GMH), for fiscal year 2015.3 These costs include salary and benefits for all OR staff and CRNAs. This cost also includes temporary employee pay and all premium (overtime) pay. It is important to note that expenses related to the anesthesiologists and surgeons are not included in this figure.
Given that staffing the OR is a key operating cost, it is critical to make the most efficient use of the time that an OR is in use. In other words, non-operative time such as turnover time should be kept to a minimum. Turnover time (TOT) is generally defined as the time from a patient leaving the OR to the following patient arriving in the OR (e.g.,4), but some facilities measure TOT from “procedure finish” time of the preceding case to “procedure start” time of the following case. We adopted the latter approach as it is currently defined that way for other improvement initiatives within GMH. If TOT can be decreased, then one would expect an increase in throughput in the OR, which will help to improve the hospital’s financial condition.5–7 The length of TOT is seen as a measure of OR efficiency4 and a source of delays in starting procedures.8 Reducing TOT length will not only reduce overtime in the OR9 but also help increase patient satisfaction by increasing timeliness of procedure start times.10
Lean management principles are being used increasingly in the surgical suite to improve performance (e.g.,9); lean management is a systematic method designed to minimize waste without sacrificing productivity. One principle of lean management is involvement of all who are involved in a process in making process improvements. This principle was implemented by Collar et al.9, Harders et al.11, and Cendan and Good12 through the use of interdisciplinary teams to reduce OR TOT. To do so, they emphasized interdisciplinary cooperation between different members of the surgical team such as surgeons and anesthesiologists. A significant conclusion of Collar et al.9 is that turnover inefficiency is due to systemic issues and not a lack of motivation.
Visual management is an important tool in lean management.13 It is, for example, used in the airline industry by visually displaying a timer to facilitate plane turnaround time. This study created a countdown timer using a mobile app to measure OR TOT. The app was both a visual management tool as well as a data collection tool. This study evaluated the following: (i) the effectiveness of the use of the countdown timer in the OR setting, (ii) the factors that contributed to prolonged OR TOT, and (iii) the impact of each delay factor on OR TOT. To evaluate the effectiveness of the countdown timer, we tested the null hypothesis that there is no difference in the mean TOT between the cases that used the timer and those that did not. The alternative hypothesis is that the TOT in cases that used the timer is less than those that did not use the timer.
Method
Mobile Application Development
We designed a mobile application named ORTimer for this study. This mobile app was designed to be used on Android-based handheld tablets. We used the standard Android Software Development Toolkit and did not need any third-party libraries because of the relative simplicity of the app. We developed the app using the Android platform after having successfully developed and tested other Android apps for health care applications.14 The app design was initiated by a request from GMH for a simple “egg timer” application that would be used to time the duration of the OR turnover. Our design process consisted of multiple design-implement-review iterations: we design and implement a version of the application, get feedback from various parties, and repeat. Starting with the “egg timer” request, we first designed a simple timer application with a start and stop button. We presented this original prototype to the nursing staff who expressed the need for other buttons that would modify the times after they had been entered. In our design meetings, we decided that the best way to implement that functionality was with the up/down arrows seen in the application. A second iteration of this process led us to add the Notes button functionality. The application was designed and implemented entirely by the authors with cooperation from GMH staff; no outside consultants were involved in the design and implementation process.
Figure 1 shows screenshots of the different functions of the app. Figures 1(a) and 1(b) show the timer itself. Figure 1(b) shows the timer after it has been started. The application will spend most of its time on this screen as it displays the countdown timer. The “Procedure Finish” button at the top-left of the screen starts the timer. The “Procedure Start” button stops the timer. The up and down arrow buttons let the user change the recorded start and stop times after the timer has been stopped. There is a “Notes” button at the bottom which brings up the Notes screen, shown in Figure 1(c), a “Submit” button which saves the results of the timed event and restarts the timer, and a “Reset” button which simply restarts the timer, throwing away the current timer values. The remaining time and the total allotted time are shown in a large font in the middle of the timer. The timer bar counts down the remaining time and is green at first, turns to yellow when less than 20% of the time remains, and finally to red after the deadline has passed. Figure 1(c) shows the Notes screen which asks the user to enter the reason(s) for a delay. It contains a list of the most common reasons so the user can check the ones that apply. The user also has the choice of entering a textual note explaining the reason for the delay in case none of the pre-defined reasons apply. The list of most common reasons was determined from both expert opinion and feedback from the textual notes entered by the CRNAs during development testing. Figure 1(d) shows the “Settings” screen where turnover time can be defined (presented as procedure finish to procedure start time) and a room chosen. This screen is reached via a menu that appears when the user taps on the button at the top-right (the three dots). This menu also contains an “Email data” option which lets the user send all the data that the app has gathered to our research staff as a CSV file attachment. The email functionality, as well as the “Settings” page, requires a password to prevent unauthorized users from viewing the data.
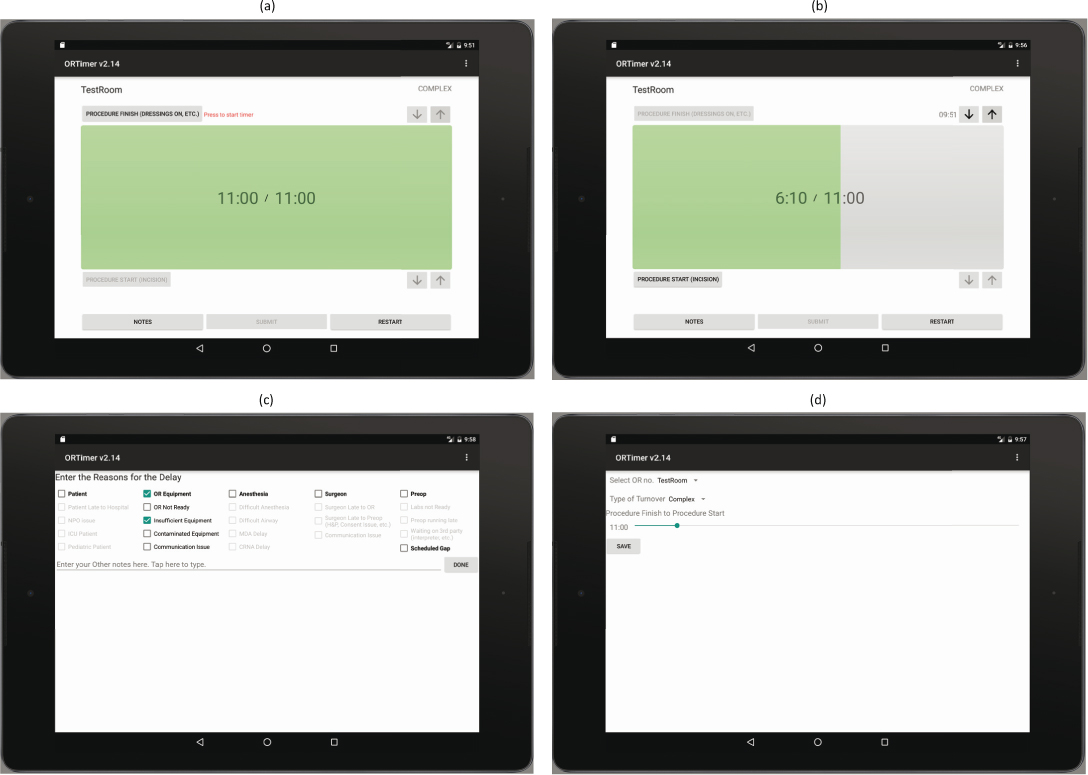
Figure 1: Screenshots of the ORTimer Mobile Application
Data Collection
The ORTimer app was implemented in the D-core (an operating ward) of GMH from May 1, 2016 to August 15, 2016. This core has 8 rooms, and the types of cases varied from simple to complex. The D-core was known to have complicated setups, i.e., the TOT between cases was likely to be larger than for the other two cores due to the nature of the cases scheduled in those rooms. The tablets with the ORTimer app installed were placed above the computer at the anesthesia workstation using off-the-shelf tablet mounting hardware. The Certified Registered Nurse Anesthetist (CRNA) was responsible for the pressing of the event milestone buttons and recording of the delay reasons, if applicable. To minimize the CRNAs’ workload, the tablets and ORTimer apps were automatically turned on at the beginning of the day using a third-party software. This approach made it easier for the CRNAs to remember to use the app and facilitated the data collection effort.
Perioperative services (POS) are performed in three phases: preoperative (Preop), intraoperative and postoperative. The Preop process involves scheduling procedures in an OR and preparing the patient before and on the day of the procedure. The intraoperative process involves the surgical procedure to be performed by a surgeon with support from POS staff. The postoperative process involves scheduling recovery rooms for the patients and providing the appropriate level of nursing care and supplies until the patient is discharged or transferred from POS to the appropriate nursing unit in the hospital.
Table 1 lists all the delay reasons, related to OR turnover, collected by the app. To record the delay reason(s), the CRNAs first had to record the primary reason (i.e., patient, OR equipment, anesthesia, surgeon, Preop, and scheduled gap) for the delay. If desired, the CRNAs could also select secondary reasons to provide more information about the delay cause. Also, more than one primary and secondary reason can be selected for one delay if multiple reasons contributed to the excess turnover time. Additionally, the app collected the elapsed TOT between the preceding and following cases. Perioperative management at GMH set a general goal for TOT to be no more than 75 minutes. Additional OR case information was extracted from GMH’s electronic medical record (EMR). This case information includes whether the patient was outpatient or inpatient, whether the case was add-on or scheduled, the number of procedures in the case, etc. Using case ID, case information was combined with the data collected from the ORTimer app. Observations with missing values were eliminated from the final dataset used for model estimation.

Table 1: Demographic Characteristics and Text messages sent and received during the three month intervention period
We did not include turnover times for cases that were not scheduled back-to-back. For these cases, there is a “scheduled gap” between the two cases which would extend the TOT. We removed these cases from consideration since their delays are not caused by the OR staff, but rather the scheduling office. For the multiple regression analysis, the response variable considered was turnover excess, which is defined as the difference between the actual TOT and the allotted TOT. Turnover excess is used to measure the amount of delay during the turnover time. Please note that turnover excess was set to zero if it is negative. A total of 232 cases with delay reasons was examined. Table 2 provides a summary of the descriptive statistics of the variables considered for model estimation. Turnover excess varies from 0 to 106.3 minutes with a mean of 11.8 minutes and standard deviation of 20.0 minutes. The number of procedures in preceding cases varies from 1 to 8 and the number of procedures in following cases varies from 1 to 6. For the testing of the proposed hypothesis (H0: there is no difference between “Timer” and “No Timer” TOTs), EMR reported unadjusted TOTs were used. This data source provided us the means to evaluate cases when the ORTimer app was used against cases when the ORTimer app was not used.
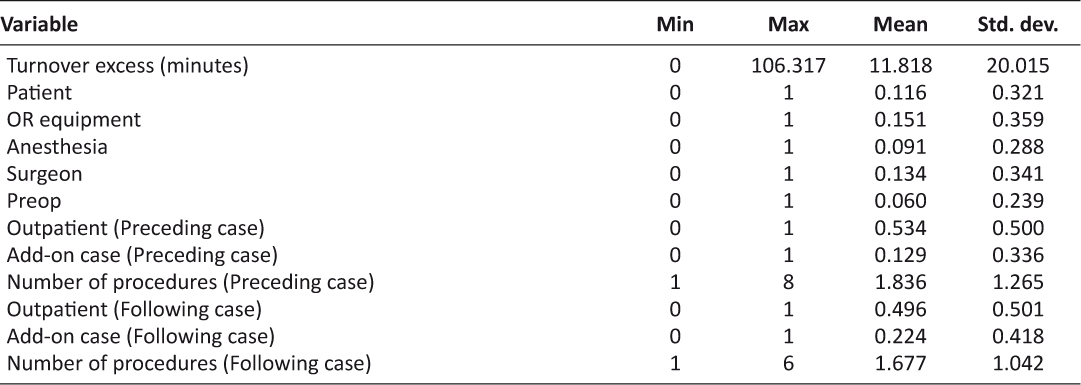
Table 2: Descriptive statistics of the variables
Data Analysis
The statistical analysis first involved the estimation of the Pearson intercorrelation between variables. The analysis also involved the assessment of multicollinearity of the predictors. To accomplish this, the variance inflation factor (VIF) was examined. Typically, VIF measures how much the variance of a coefficient is increased due to multicollinearity. VIF ≥ 10 indicates a serious multicollinearity problem.15 Next, a multiple regression analysis was conducted. The overall R2 and adjusted R2 of the regression model were calculated to assess the percentage of the variance in the turnover excess time that was explained by the predictors. Lastly, the proposed hypothesis that the use of a countdown timer is effective in an OR environment was tested by employing a two-sample t-test.
Results and Discussion
Results of the Pearson intercorrelation analysis of the predictors are presented in Table 3. An outpatient is a patient who is scheduled for a surgery and is not admitted overnight. A preceding case is the surgery occurring in the OR before the TOT under consideration and a following case is the surgery after the TOT under consideration. The correlation between turnover excess and the predictors was found to be low to medium, with the Pearson correlation values (r) ranging from 0.07 to 0.38. The predictor having the strongest correlation with turnover excess was outpatient from a following case (r = −0.38, p < 0.01). The results also indicate that some of the predictors have strong correlations with each other. For instance, add-on case (following case) was strongly correlated with add-on case (preceding case) (r = 0.50, p < 0.01) and with outpatient (following case) (r = −0.35, p < 0.01). In contrast, the correlation between add-on case (following case) and patient was found to be low (r = 0.16, p < 0.05). The correlations between OR equipment and patient (r = −0.12, p < 0.1), add-on case (preceding case) and OR equipment (r = 0.12, p < 0.1), and add-on case (preceding case) and anesthesia (r = −0.12, p < 0.1) were also found to be low.
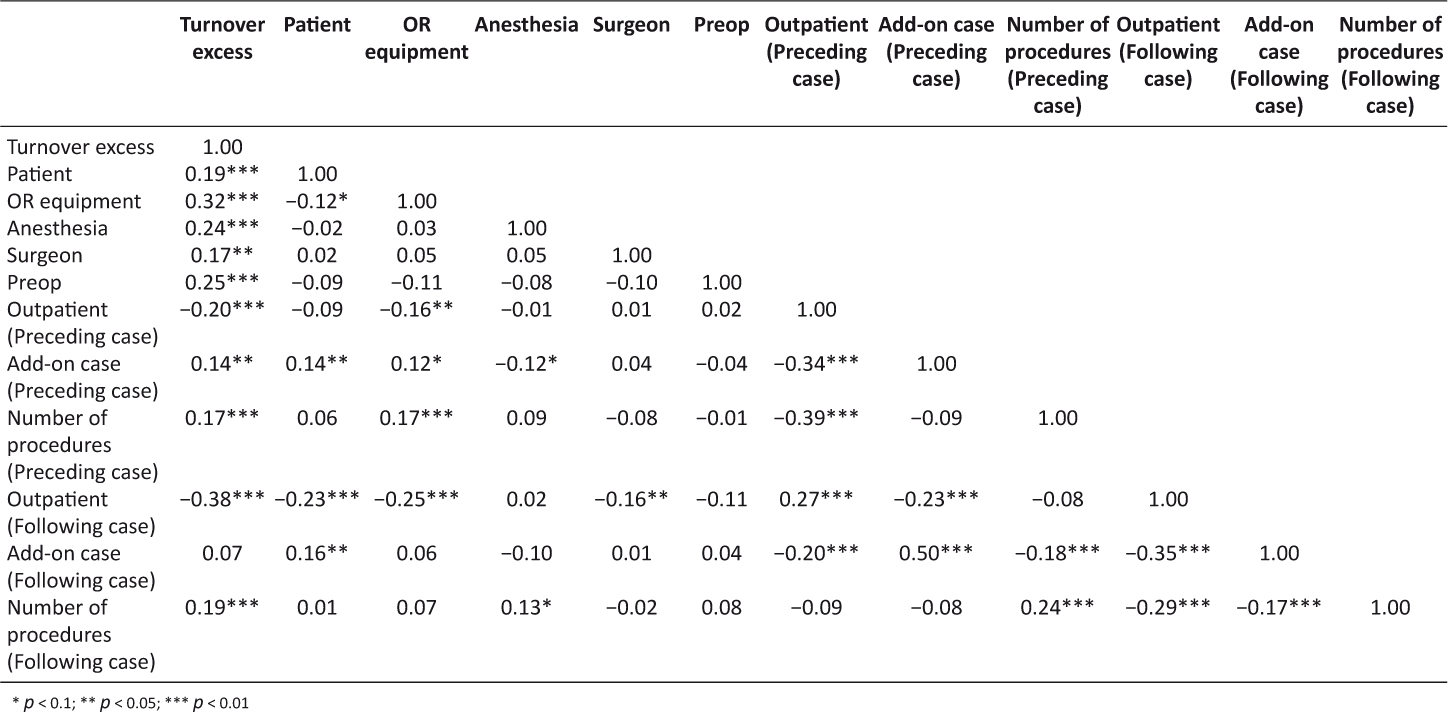
Table 3: Correlations for turnover excess and predictor variables
The estimated multiple linear regression model is reported in Table 4. The table shows the unstandardized regression coefficients (β), standardized regression coefficients (β’), t-statistics and corresponding p-values, 90% confidence intervals of the coefficients, VIF values, coefficient of determination (R2 and adjusted R2), and overall model significance (F-test). VIF values of predictors suggest that there is no serious problem with multicollinearity in the data. The coefficients of all of the predictors except for the number of procedures (preceding case) are statistically significant at 0.1 significance level.
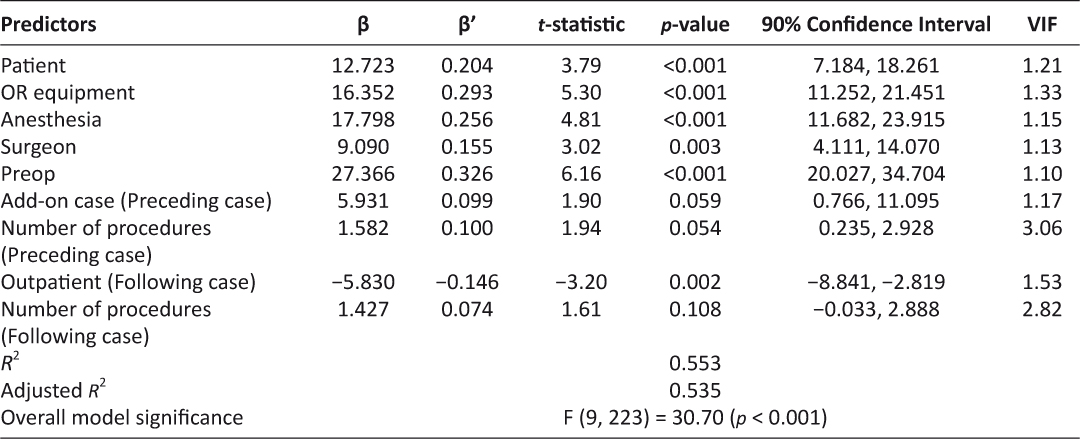
Table 4: Model estimation results
A delay due to patient-related issues contributed an estimated 12.7 minutes to OR turnover excess time, with all other predictors held constant. That is, when OR TOT exceeds the allotted time threshold and there are patient-related issues, the following case is pushed back by estimated additional 12.7 minutes. With a 90% confidence interval, this extra OR TOT is between 7.2 and 18.3 minutes. In case of delay due to OR equipment, holding all other predictors fixed, an estimated 16.4 minutes is added to the turnover excess time. With a 90% confidence interval, this excess time is between 11.3 and 21.5 minutes.
Holding all other predictors fixed, if there is a delay in anesthesia, an estimated 17.8 minutes of additional time is required beyond the allotted OR TOT. This time is between 11.7 and 23.9 minutes, with a 90% confidence interval. In case of delay due to surgeons, an estimated 9.1 minutes is added to the following case start time, holding all other predictors fixed. With 90% confidence, this time is between 4.1 and 14.1 minutes. Preop being the reason for delay in OR adds an estimated 27.4 minutes to turnover excess time, holding all other predictors fixed. With 90% confidence, this time is between 20.0 and 34.7 minutes.
A preceding case being an add-on case increases turnover excess time by an estimated 5.9 minutes when all other predictors are fixed. That is, an add-on case contributes an extra 5.9 minutes to OR turnover excess time compared to that of a regular case. In the case of a preceding case, each procedure in the case adds an estimated 1.6 minutes to the OR turnover excess time.
When all other predictors are fixed, OR turnover excess time is found to decrease by an estimated 5.8 minutes for an outpatient relative to an inpatient in the following case. Each procedure in a following case adds an estimated 1.4 minutes to OR turnover excess time.
The variable Preop has the highest absolute standardized regression coefficient (β’ = 0.326). That means Preop is the most significant variable in explaining OR turnover excess time. Lastly, the overall model is statistically significant, F (9, 223) = 30.70 (p < 0.001), and the model explains 55.3% of total variation in OR turnover excess time (R2 = 0.553).
During the data collection period at GMH, data was collected for 695 OR cases. Of these, 433 records had turnover times exceeding 75 minutes. Potential reasons for this longer TOT are: gaps in the schedule, surgeons canceling/rescheduling their cases for a later date, patient NPO (patient ate before surgery) issues, and surgeon unavailability (assisting in another case, etc.). We divided these 433 records into two groups, based on the whether the ORTimer app was used or not—referred to as “Timer” (125 records) and “No Timer” (308 records). It is evident from Figure 2 that “No Timer” has more spread than “Timer”, i.e., the interquartile range of the first group is wider than that of second group. To verify whether there is a statistical difference between OR turnover times in the “Timer” and “No Timer” groups, a two-sample t-test was conducted. The null hypothesis (H0) is that there is no difference between the “Timer” and “No Timer” turnover times. The alternative hypothesis (H1) is that the “Timer” turnover time is less than that of the “No Timer” turnover time. Table 5 summarizes the results of the t-test which yields a p-value of 0.027. Thus, the null hypothesis can be rejected at the 0.05 significance level and we can conclude that the use of a countdown timer is effective in an OR environment.

Table 5: Hypothesis test results
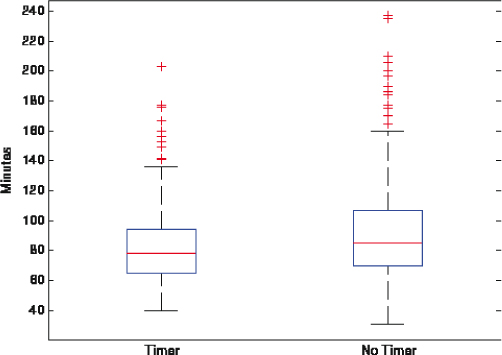
Figure 2: Box Plot of the TOT Groups
Limitations
This study has three limitations that should be considered when interpreting its findings. First, this study used data from only one hospital and only one core. Second, the ORTimer app was not used by all CRNAs and not utilized in all OR cases in the D-core during the study period. Lastly, this study was observational in nature and not controlled. This is because the research was performed in a working hospital, and therefore, the study team had to allow the CRNAs the discretion to do what they viewed was best for the patient and the hospital.
Conclusion
As is the case with most production environments,1 the use of a visual management tool such as the countdown timer in the OR is found to be effective. The developed ORTimer mobile app enabled us and perioperative managers to obtain delay reasons for prolonged OR turnover time (TOT). This data set combined with the hospital’s electronic medical record (EMR) provided a rich data set for identifying the factors that contribute to prolonged OR TOT and quantifying their impacts.
The ORTimer app can indirectly lead to better patient outcomes since patients will spend less time in Preop and potentially less time receiving operative care when the staff are more coordinated in their efforts. Additionally, decreased TOT will decrease Preop waiting time for patients, which is highly correlated with patient satisfaction scores.
Due to the successful deployment of the ORTimer app in the D-core at Greenville Memorial Hospital (GMH), it is being deployed in the Gastrointestinal (GI) labs at GMH as well. The GI labs are typically used for simpler cases where TOTs average approximately 16 minutes in duration. It will be interesting to see how the results from the GI labs compare to that of D-core. In addition, talks between GMH and EMR IT staff are underway regarding the integration of the ORTimer app and EMR. Specifically, discussions have focused on allowing “Health Level 7” messages to be transmitted to a server in which the ORTimer app would pick up the data and decode it into usable information to run the timer. Such information would include procedure finish (to start the timer) and procedure start (to finish the timing of the turnover). This approach would allow the app to be used without any human intervention (pressing of buttons). Once implemented, this integration will open the way for automatic milestone documentation through the electronic medical record which would eliminate unnecessary double documentation. This integration will also allow us to capture more specific information about the patient and/or case in future versions of the app.
Acknowledgements
This research was supported by the National Science Foundation under grant IIS-1237080. In addition, we would like to acknowledge staff at Greenville Memorial Hospital for their continued participation and enthusiasm for process improvement research projects and studies. In particular, we would like to acknowledge Brad Hoover, Adam McKee and the rest of the CRNAs for their support and feedback during design and implementation of the ORTimer app.
References
1. Ortiz CA, Park M. Visual Controls: Applying Visual Management to the Factory. New York, NY: CRC Press 2010.
2. Park KW, Dickerson C. Can efficient supply management in the operating room save millions? Curr Opin Anaesthesiol 2009;22(2):242–8. ![]()
3. Allen RW, Pruitt M, Taaffe KM. Effect of resident involvement on operative time and operating room staffing costs. J Surg Educ 2016;73(6):979–85. ![]()
4. Kodali BS, Kim D, Bleday R, et al. Successful strategies for the reduction of operating room turnover times in a tertiary care academic medical center. J Surg Res 2014;187(2):403–11. ![]()
5. Macario A, Dexter F, Traub RD. Hospital profitability per hour of operating room time can vary among surgeons. Anesth Analg 2001;93(3):669–75. ![]()
6. Seim AR, Dahl DM, Sandberg WS. Small changes in operative time can yield discrete increases in operating room throughput. J Endourol 2007;21(7):703–8. ![]()
7. Krupka DC, Sandberg WS. Operating room design and its impact on operating room economics. Curr Opin Anaesthesiol 2006;19(2):185–91. ![]()
8. Porta CR, Foster A, Causey MW, et al. Operating room efficiency improvement after implementation of a postoperative team assessment. J Surg Res 2013;180(1):15–20. ![]()
9. Collar RM, Shuman AG, Feiner S, et al. Lean management in academic surgery. J Am Coll Surg 2012;214(6):928–36. ![]()
10. Warner CJ, Walsh DB, Horvath AJ, et al. Lean principles optimize on-time vascular surgery operating room starts and decrease resident work hours. J Vasc Surg 2013;58(5):1417–22. ![]()
11. Harders M, Malangoni MA, Weight S, et al. Improving operating room efficiency through process redesign. Surgery 2006;140(4):509–14. ![]()
12. Cendan JC, Good M. Interdisciplinary work flow assessment and redesign decreases operating room turnover time and allows for additional caseload. Arch Surg 2006;141(1):65–9. ![]()
13. Hino S. Inside the Mind of Toyota: Management Principles for Enduring Growth. New York, NY: Productivity Press 2005.
14. Uddin MM, Huynh N, Vidal JM, et al. Evaluation of Google’s voice recognition and sentence classification for health care applications. Eng Manag J 2015;27(3):152–62. ![]()
15. Neter J, Wasserman W. Applied Linear Statistical Models. Irwin, Chicago: McGraw-Hill 1996.

